Los Angeles

Analysis: Average days on market for homes sold in 2017 and what it means for sellers.

Having the right expectations can mean the difference between closing the best deal and settling for a lower price. This is especially true when it comes to optimal days on market for residential listings.

In this post, we analyzed about 2700 deals closed in the LA area for 2017 to give sellers a view into what they can expect when they enter the playing field.

Key takeaways:

  • About 2700 residential property deals (from single family homes to condos & town houses) have closed in 2017 year-to-date (**see areas below).
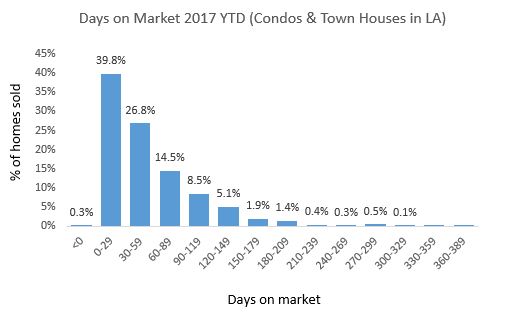
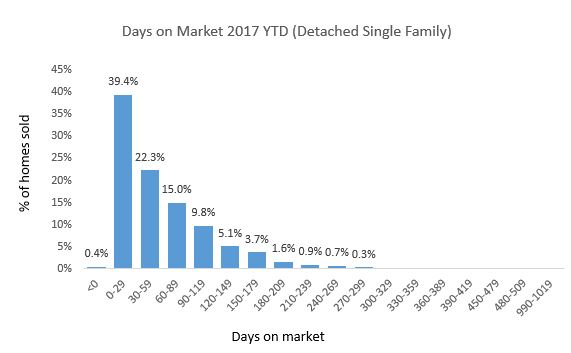
  • On average, detached single family homes are on the market for 59 days before selling. On average, condos & town homes are on the market for 54 days before selling. Median days on market are notably much lower. The median days on market for detached single family homes is 42 and for condos & town homes 40.
  • When average is higher than median, this means a small group of homes are staying on the market much longer and pulling the averages up. In reality, the most realistic expectation for most sellers is around 40-42 days, or just over a month.
  • For condos and town houses, 40% of homes sell within the first month of being listed. The same is true for detached single family homes. So another reality is that most will be waiting more than a month.
  • When we look at days on market by home size, numbers change significantly. Homes under 1800 square feet can expect to sell within the first 2 months, but above 1800 square feet we see numbers go up significantly above 2 months.
  • Size plays a big role in how long you can expect for your home to sit in the market in LA.

**Areas we analyzed: Los Angeles, Burbank, Glendale, Pasadena, Sherman Oaks, Northridge, Tarzana, Beverly Hills, Granada Hills, Van Nuys.**

So what does this all mean? First, sellers are facing days on market upwards of a month on average for both detached single family homes and condos. This is mostly true for homes below 1800 square feet. So if you fall into this category, it is not unfair to expect this type of performance from your realtor.

Second, larger homes are sitting on the market much longer. Homes above 1800 square feet can expect upwards of 2 months sitting on the market. Thus, folks with larger homes and their realtors have more work to do in terms of finding and competing for the right buyers. Based on this early data, larger homes and the luxury market are facing the most headwinds.

All in all, 2017 is shaping up to be what I call a year for strategic patience. But if you can't afford to wait and don't want to put your future on hold (nor should you!), there are ways to beat these numbers and we have proven strategies to do so.

Interested in learning more? Feel free to reach out and get a better idea of what we can do for you. You can also try our free market analysis, and we'll provide something tailored just for you to get you started on your selling journey.

LA homeowners cash in on Airbnb hosting, company data shows.

Low supply of rentals in LA are starting to pay dividends for homeowners who are leveraging Airbnb for extra cash. Hosts in LA made a combined $262M in 2016, making it the top Airbnb city in California.

As a prime destination for dreamers looking to open up shop and tourists looking to experience LA the way locals do, it makes perfect sense Angelinos are able to cash in on the Airbnb phenomena. In a previous post, we discussed a fundamental reality in the greater LA area for both rentals and residential listings -- low supply and high demand. 

The economics can't be denied and we're seeing it play out in the the Airbnb circuit. In fact, the LA times reports that Californians sharing their homes through the Airbnb platform grew 51% in 2016 compared to 2015. That's over 76,000 hosts in CA in 2016 compared to about 50,000 in 2015. 

With about 1M guests annually, LA is the top city in California, followed by San Francisco (444,000 guests) and San Diego (357,300 guests) rounding out the top 3.

What does this mean for homeowners? What are the implications for those looking to sell? Feel free to reach out and we can talk strategy. Otherwise, you can also try out our free market service to get a lay of the land in your neighborhood.

Analysis: Active residential listings in LA and where there's lots of action. (Part 2)

We analyzed 2000 residential properties sold in 2017 thus far. Here's what we learned about what's selling, at what prices and at what volume. This is especially useful for homeowners looking to sell and get into the market mix.

Key takeaways:

  • About 2000 residential property deals (from single family homes to condos) have closed in 2017 year-to-date (**see areas below). The average close price is about $1M, while the median is about $700K. In other words, these are the prices homes are typically selling for across the greater LA area.
  • These prices are dramatically different from what we're seeing in the current active listing space. If you recall from the previous post, the average price of active listings is $2.2M while the median is $988K. These are 200% higher than the average and 50% higher than the median of what's actually been closing.
  • Almost 50% of deals are for properties between 1000 - 1500 square feet. This is where the bulk of the competition is highly concentrated. These homes are selling for anywhere between $600K - $800K on average. These are pricing anchors for sellers who want to charge closer to $1M for homes within this size range.
  • Interestingly, 25% of deals are for homes above 2000 square feet. This highlights the ability of larger homes to take a chunk out of the selling share. Larger homes are definitely closing at a healthy pace, so there's clear demand.
  • For homes between 2000 - 2800 square feet, $1.1M - $1.6M seems to be the sweet spot price range based on average closing prices in 2017.

**Areas we analyzed: Los Angeles, Burbank, Glendale, Pasadena, Sherman Oaks, Northridge, Tarzana, Beverly Hills, Granada Hills, Van Nuys.**

So what does this all mean? First, closing prices are way below the prices of active listings, so as we've mentioned, there will be pressure to defend value. We do know that supply is low, so sellers can still have an advantage if they position their homes the right way.

Second, there are pricing anchors for areas where there's high competition in terms of square footage. Sellers should be aware of this and be sure to focus on key differentiators of their homes and neighborhoods that justify prices above median or average.

Interested in talking strategy? We can help. You can also try our free market analysis, and we'll provide something tailored just for you.

LA housing market needs a boost!

The most recent Census report highlights national home ownership rates remained flat at 63.7%. LA, however, continues to lag with a 49% home ownership rate. As we've noted here at Contempo Realtors, low supply, coupled with higher prices can pose a big challenge for buyers. We've gotta make moves and increase supply!

Climbing LA prices means current inventory will be increasingly unaffordable to most Angelinos. Meanwhile, cities like Dallas and Houston are becoming more accessible. With more favorable regulations for development and urban sprawl, Texas certainly has an advantage over California, which is bedeviled with highly restrictive building regulations.

Here's an interesting piece from the Hill about what legislators can do with zoning ordinances to boost LA's housing market.

Are you thinking about selling your home? Do you want to know how all of this impacts you? Please reach out for a free consultation.

Americans Are Flipping Houses Like It’s 2006

House flipping has made a strong comeback. Home flippers accounted for 6.1 percent of U.S. home sales in 2016. That’s the highest share since 2006, when flips accounted for 7.3 percent of sales.